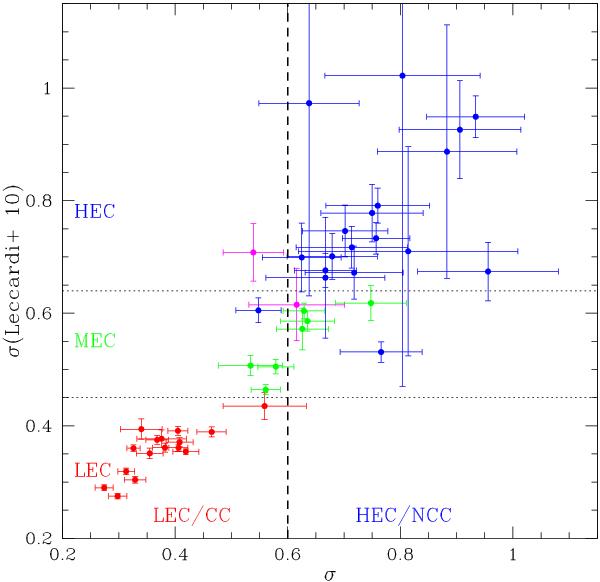
Fig. 2

Distribution of the values of the pseudo-entropy ratio σ computed using the radial regions adopted in this paper vs. the values of σ computed using the radial range used in Leccardi et al. (2010) for the intermediate redshift cluster sample of Leccardi & Molendi (2008). The red, green, and blue squares represent the systems classified in the literature as CC, uncertain, and NCC , respectively. The purple squares are the clusters classified in the literature as “dubious” CC. The dotted horizontal lines represents the boundary chosen by Leccardi et al. (2010) to separate among LEC, MEC and HEC clusters. The dashed thick vertical line represent the boundary we have chosen to distinguish between LEC/CC and HEC/NCC clusters. Evidently, our classification method for CC and NCC agrees very well with the literature and with the method of Leccardi et al. (2010).
Current usage metrics show cumulative count of Article Views (full-text article views including HTML views, PDF and ePub downloads, according to the available data) and Abstracts Views on Vision4Press platform.
Data correspond to usage on the plateform after 2015. The current usage metrics is available 48-96 hours after online publication and is updated daily on week days.
Initial download of the metrics may take a while.


