Fig. 9
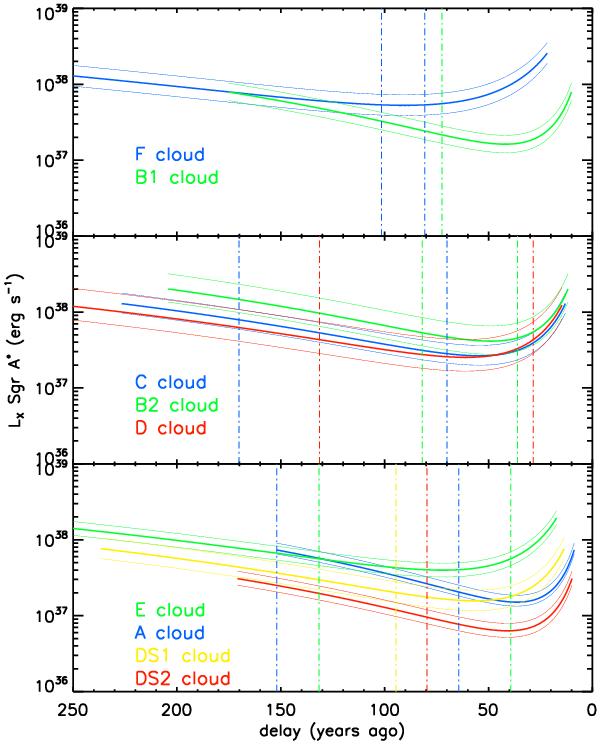
X-ray luminosity as a function of the time delay for the different MCs, as inferred from the measured cloud properties. We have divided the MCs into subgroups depending on the type of Fe-Kα line variability exhibited. Also plotted are the 90% confidence ranges on the LX calculation. The vertical dotted lines represent the constraints on θ derived in Sect. 4.1. Where only one vertical line is shown for a cloud, it represents the right-hand boundary of the allowed range; in these cases the second boundary is situated to the left of the Y axis (i.e., θ ≥ 155 deg), and therefore not plotted.
Current usage metrics show cumulative count of Article Views (full-text article views including HTML views, PDF and ePub downloads, according to the available data) and Abstracts Views on Vision4Press platform.
Data correspond to usage on the plateform after 2015. The current usage metrics is available 48-96 hours after online publication and is updated daily on week days.
Initial download of the metrics may take a while.