Fig. 8
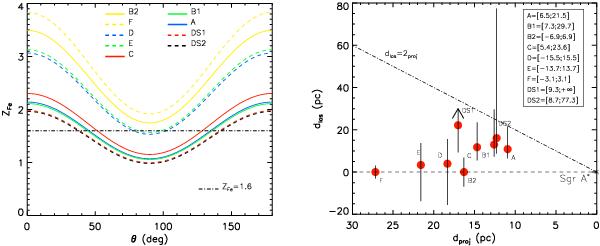
Left panel: relative Fe abundance ZFe as a function of the scattering angle θ for the different MCs obtained by using the measured EW and Eq. (3). The horizontal dashed-dotted line represents the average metallicity (ZFe = 1.6) inferred for set of MCs. Right panel: line-of-sight displacement plotted against the projected distance dproj for each MC. The dlos value for the DS1 cloud is a lower limit (dlos ≥ 9.3 pc). The horizontal dashed line represents the plane of Sgr A* at dlos = 0. The dashed-dotted line shows the line dproj = 2 × dlos. We make the assumption that the clouds are located in the region between the dashed and dashed-dotted lines (see text). The permitted dlos range (in pc) for each cloud is given in the top-right box. Note: the method does not distinguish between whether an individual cloud lies in front or behind the plane of Sgr A* (i.e., at +ve or –ve dlos).
Current usage metrics show cumulative count of Article Views (full-text article views including HTML views, PDF and ePub downloads, according to the available data) and Abstracts Views on Vision4Press platform.
Data correspond to usage on the plateform after 2015. The current usage metrics is available 48-96 hours after online publication and is updated daily on week days.
Initial download of the metrics may take a while.