Free Access
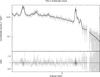
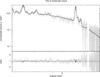
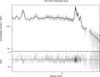
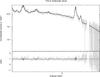
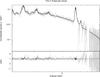
Fig. 6
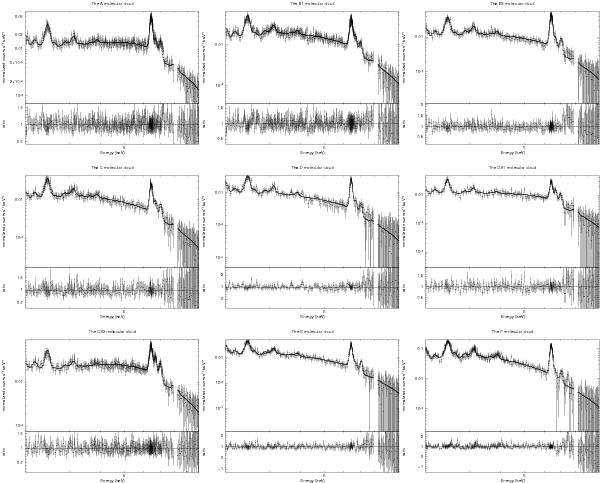
Time-averaged PN spectra of the set of MCs in the present study. Each panel shows the measured data along with the best fitting spectral model and (in the lower section) the ratio of these two quantities. The spectral channels encompassing the Cu-Kα line at 8.05 keV (7.8–8.2 keV) have been excluded from the fitting.
This figure is made of several images, please see below:

Current usage metrics show cumulative count of Article Views (full-text article views including HTML views, PDF and ePub downloads, according to the available data) and Abstracts Views on Vision4Press platform.
Data correspond to usage on the plateform after 2015. The current usage metrics is available 48-96 hours after online publication and is updated daily on week days.
Initial download of the metrics may take a while.