Fig. 5
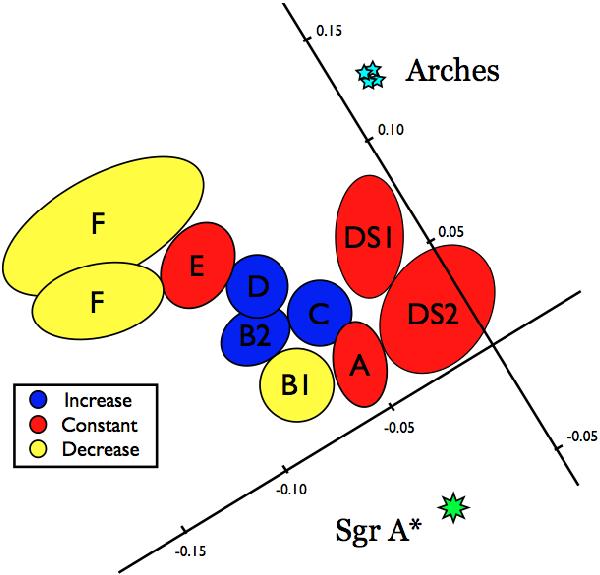
Colour-coded sketch of the molecular clouds and Fe-Kα line flux variability studied in this work. The circles and ellipses represent the regions selected for the timing and spectral studies (see also the right panel of Fig. 2). The colours are blue (increase of the 6.4-keV line flux), red (constant) and yellow (decrease). A Galactic coordinate grid, and the positions of Sgr A* (green star) and the Arches cluster (cyan stars) are also indicated.
Current usage metrics show cumulative count of Article Views (full-text article views including HTML views, PDF and ePub downloads, according to the available data) and Abstracts Views on Vision4Press platform.
Data correspond to usage on the plateform after 2015. The current usage metrics is available 48-96 hours after online publication and is updated daily on week days.
Initial download of the metrics may take a while.