Fig. 3
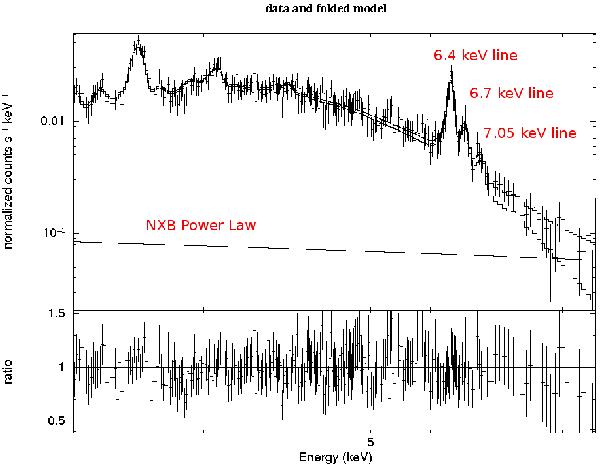
Upperpanel: the spectrum derived for Region B1 from the September 2004 MOS1 dataset together with the best-fitting spectral model. The lower solid line shows the NXB power-law component. The two curves show the net X-ray source spectrum and the source plus NXB best fit model (top curve). Three Fe lines are labelled; neutral Fe-Kα and Kβ lines at 6.4 and 7.05 keV, and the Fe XXV Kα line at 6.7 keV. Lowerpanel: ratio between the spectral points and the best fit model.
Current usage metrics show cumulative count of Article Views (full-text article views including HTML views, PDF and ePub downloads, according to the available data) and Abstracts Views on Vision4Press platform.
Data correspond to usage on the plateform after 2015. The current usage metrics is available 48-96 hours after online publication and is updated daily on week days.
Initial download of the metrics may take a while.