Free Access
Fig. 14
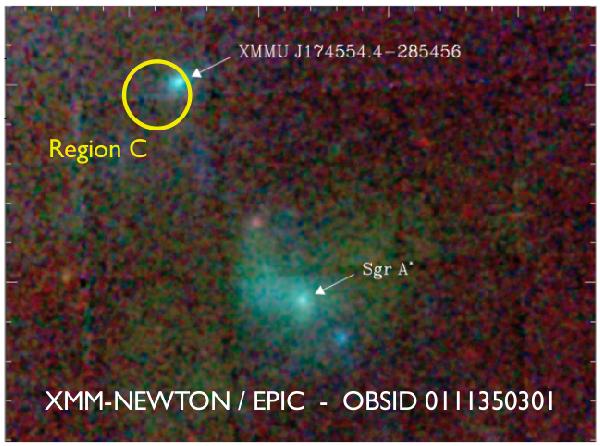
XMM-Newton/EPIC colour image of the X-ray transient XMMU J174554.4-285456 (Porquet et al. 2005). The colour coding is as follows: red (0.2–2 keV), green (2–5 keV) and blue (5–10 keV). The yellow circle on the top of the image shows region C.
Current usage metrics show cumulative count of Article Views (full-text article views including HTML views, PDF and ePub downloads, according to the available data) and Abstracts Views on Vision4Press platform.
Data correspond to usage on the plateform after 2015. The current usage metrics is available 48-96 hours after online publication and is updated daily on week days.
Initial download of the metrics may take a while.