Fig. 13
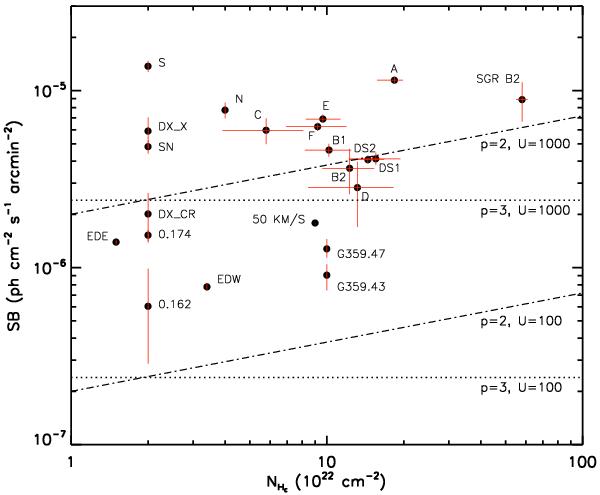
Surface brightness of the Fe-Kα line measured from the MCs in the CMZ, plotted against their estimated column density, NHC. The labels indicate the identity of each cloud, while the lines represent model predictions for CR electron densities of 100 and 1000 eV/cm3 (lower and upper lines respectively), for assumed slopes of the electron energy spectrum of p = 2 (dotted lines) or p = 3 (dashed lines). CR contribution band as described in the text.
Current usage metrics show cumulative count of Article Views (full-text article views including HTML views, PDF and ePub downloads, according to the available data) and Abstracts Views on Vision4Press platform.
Data correspond to usage on the plateform after 2015. The current usage metrics is available 48-96 hours after online publication and is updated daily on week days.
Initial download of the metrics may take a while.