Fig. 11
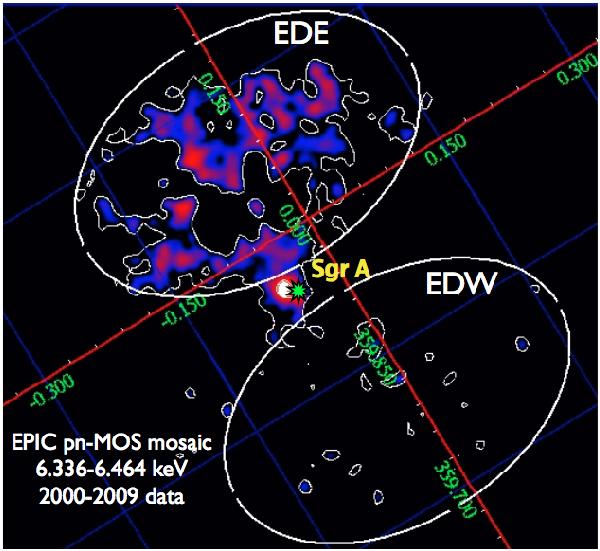
A colour-coded and contoured map of the 6.4-keV line emission in GC region. The contours levels are scaled in arbitrary units. The position of Sgr A* is marked with the green star in the centre of the image, whereas the bright spot close to it is the Sgr A EAST SNR complex. The regions selected for the spectral analysis lie within the two ellipses marked as EDE and EDW. However, the bright MCs studied in this paper and in Capelli et al. (2011b), which are all located in the EDE region, have been blanked out.
Current usage metrics show cumulative count of Article Views (full-text article views including HTML views, PDF and ePub downloads, according to the available data) and Abstracts Views on Vision4Press platform.
Data correspond to usage on the plateform after 2015. The current usage metrics is available 48-96 hours after online publication and is updated daily on week days.
Initial download of the metrics may take a while.