Fig. 10
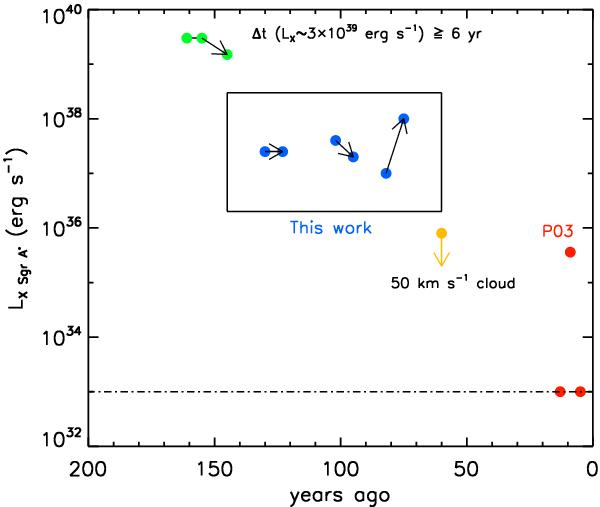
X-ray light curve of Sgr A* over the past 250 years. The green points at LX ~ 1039 erg s-1 show the constraints on the Sgr A* activity inferred from the Fe-Kα measurements in the Sgr B2 cloud (see text, Inui et al. 2009; Terrier et al. 2010). The red points show the current quiescence level of Sgr A*, together with the brightest flare ever measured (Porquet et al. 2003, P03). The blue points in the box show the results of this work.
Current usage metrics show cumulative count of Article Views (full-text article views including HTML views, PDF and ePub downloads, according to the available data) and Abstracts Views on Vision4Press platform.
Data correspond to usage on the plateform after 2015. The current usage metrics is available 48-96 hours after online publication and is updated daily on week days.
Initial download of the metrics may take a while.