Fig. 1
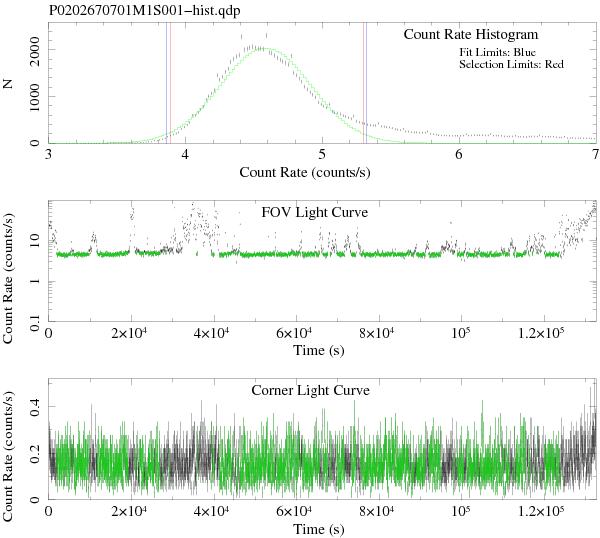
Soft proton flare filtering of the MOS1 dataset from OBSID 0202670701. Upper panel: 2.5–12 keV count rate histogram. The blue lines mark the region used in the Gaussian fit, the green line represents the best fit Gaussian and the red lines show the bounds used to filter the data. Mid panel: 2.5–8.5 keV lightcurve of the IN FOV region. Lower panel: 2.5–8.5 keV lightcurve of the corner data. In both the Mid and the Lower panels, the points coloured green in the light-curves correspond to the selected GTI intervals (see text).
Current usage metrics show cumulative count of Article Views (full-text article views including HTML views, PDF and ePub downloads, according to the available data) and Abstracts Views on Vision4Press platform.
Data correspond to usage on the plateform after 2015. The current usage metrics is available 48-96 hours after online publication and is updated daily on week days.
Initial download of the metrics may take a while.