Fig. 4
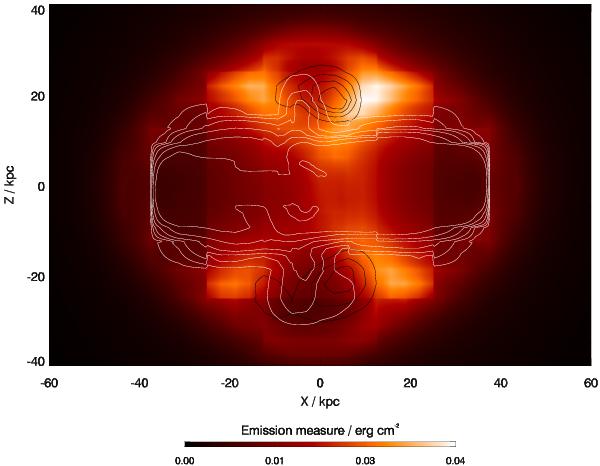
Simulated X-ray emission measure map of the interaction of two perpendicular jets in Cyg A. The four bright regions are shaped by the cavities of the first jets. The cavities of the main jets are also visible. Black contours show the volume fraction of the first jets at 2n × 10-5. That of the main jets is at 1, 3, 6, 12, 24, and 48 × 10-3 in white. Rectangular features are due to artifacts of the nested static grid setup.
Current usage metrics show cumulative count of Article Views (full-text article views including HTML views, PDF and ePub downloads, according to the available data) and Abstracts Views on Vision4Press platform.
Data correspond to usage on the plateform after 2015. The current usage metrics is available 48-96 hours after online publication and is updated daily on week days.
Initial download of the metrics may take a while.