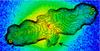
Fig. 3
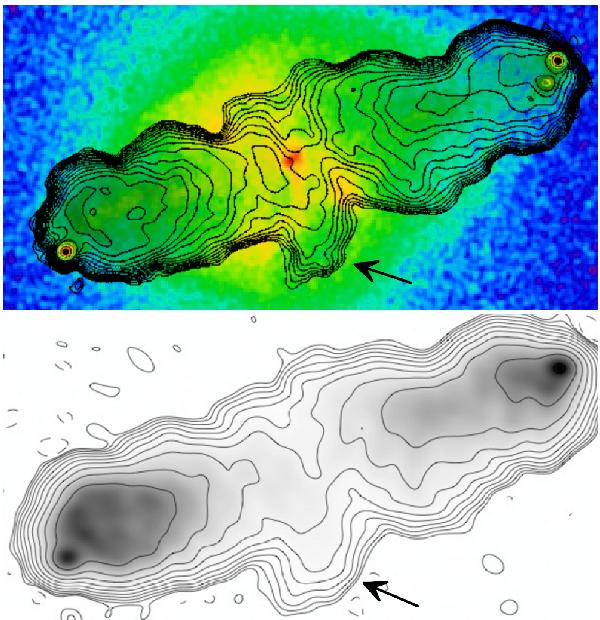
Upper panel: overlay of a VLA radio map at 327 MHz as contours on the Chandra image. The VLA contours are taken from Fig. 2 of Lazio et al. (2006). The low surface brightness cavity of our study in the X-ray image spatially matches the excess in the radio contours. The cavity is enclosed by a brighter rim in the south. Lower panel: the LOFAR contours are taken from Fig. 1 of McKean et al. (2011). On request by the LOFAR collaboration we do not show an overlay with the LOFAR data. However, we emphasise that the location of our X-ray cavity coincides exactly with the radio excess shown by the LOFAR contours as well. To guide the eye both figures are on the same scale. In both panels the location of the X-ray cavity is indicated by an arrow.
Current usage metrics show cumulative count of Article Views (full-text article views including HTML views, PDF and ePub downloads, according to the available data) and Abstracts Views on Vision4Press platform.
Data correspond to usage on the plateform after 2015. The current usage metrics is available 48-96 hours after online publication and is updated daily on week days.
Initial download of the metrics may take a while.