Fig. 8
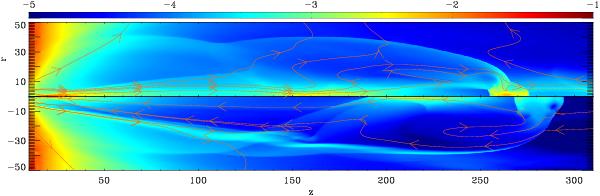
Logarithmic density and field lines for models VRP (top) and VRA (bottom). The two jets correspond to the two hemispheres of a YSO and are shown side by side for comparison. The shock front and matter condensations along the axis are found at different locations between the two cases.
Current usage metrics show cumulative count of Article Views (full-text article views including HTML views, PDF and ePub downloads, according to the available data) and Abstracts Views on Vision4Press platform.
Data correspond to usage on the plateform after 2015. The current usage metrics is available 48-96 hours after online publication and is updated daily on week days.
Initial download of the metrics may take a while.