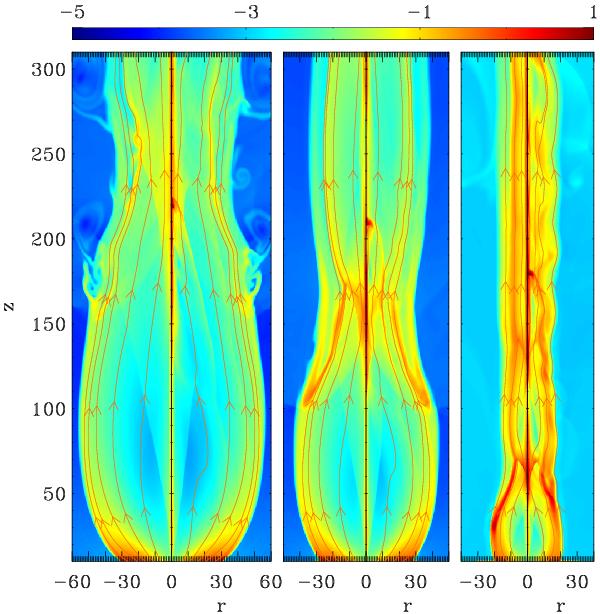
Fig. 11
Logarithmic density and field lines for models NIPL, VIPL, NIPH, VIPH, NIPVH, and VIPVH (from left to right). The left and middle panels correspond to the northern and southern hemispheres of Fig. 2, respectively. The right panel displays the scenario of a very high external pressure in order to visualize the oscillation of the jet’s cross section. Each panel shows the unperturbed model on the left and the time variable counterpart on the right. The outer structure and the condensations along the jet axis are static and unaffected by flow fluctuations.
Current usage metrics show cumulative count of Article Views (full-text article views including HTML views, PDF and ePub downloads, according to the available data) and Abstracts Views on Vision4Press platform.
Data correspond to usage on the plateform after 2015. The current usage metrics is available 48-96 hours after online publication and is updated daily on week days.
Initial download of the metrics may take a while.