Free Access
Fig. 2
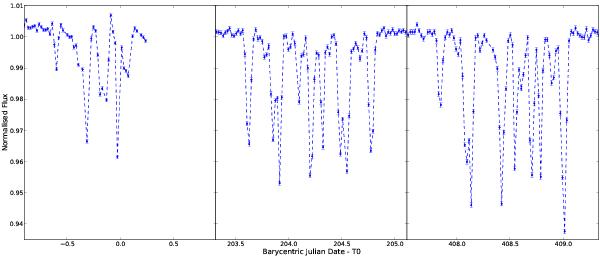
The three tertiary crossings available in the public data, in quarters 1, 4 and 6. Crossings are referred to as Crossing 1, 2 and 3, from left to right respectively. Light curves are displayed after removal of the binary signal. Dashed lines are simple connections of data points, for clarity, and do not stem from a model.
Current usage metrics show cumulative count of Article Views (full-text article views including HTML views, PDF and ePub downloads, according to the available data) and Abstracts Views on Vision4Press platform.
Data correspond to usage on the plateform after 2015. The current usage metrics is available 48-96 hours after online publication and is updated daily on week days.
Initial download of the metrics may take a while.