Fig. 2
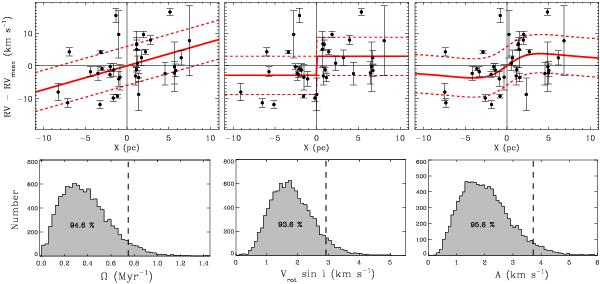
Top: RV in the system of the cluster as a function of distance X from the optimal rotation axis for models with constant rotation rate (left), constant rotational velocity (centre), and the more realistic rotation curve discussed above (right). The best-fit rotation curves are shown as solid lines, and ± σ1D envelopes are represented by dashed lines. Bottom: histogram of amplitudes Ω (left), Vrot (centre) and A (right) from 10 000 Monte Carlo simulations of RV distributions with no rotation. The optimal values for the observed RV configuration are indicated by dashed vertical lines. Confidence levels of 94.6%, 93.6% and 95.6% are found respectively for the best-fit amplitude of each model.
Current usage metrics show cumulative count of Article Views (full-text article views including HTML views, PDF and ePub downloads, according to the available data) and Abstracts Views on Vision4Press platform.
Data correspond to usage on the plateform after 2015. The current usage metrics is available 48-96 hours after online publication and is updated daily on week days.
Initial download of the metrics may take a while.