Fig. 1
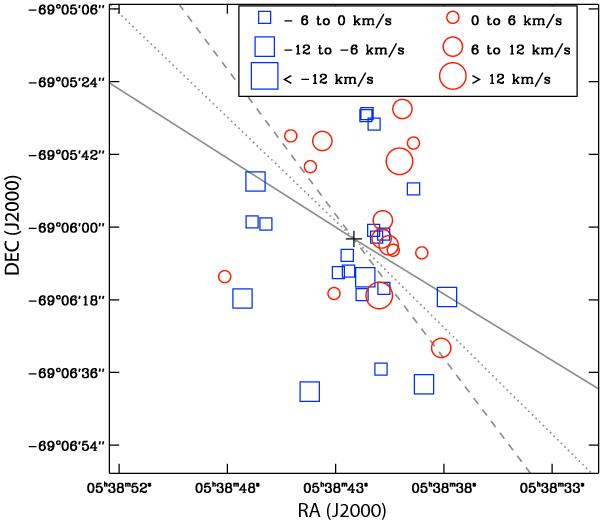
Illustration of the positions and RVs of the stars considered in this study. Symbol sizes denote the magnitude of the stellar velocities with respect to the average cluster velocity. The solid, dotted, and dashed lines correspond to the optimal rotation axis determined for models with a constant rotational velocity, a constant rotation rate, and a more realistic rotation curve (see Sect. 3), respectively.
Current usage metrics show cumulative count of Article Views (full-text article views including HTML views, PDF and ePub downloads, according to the available data) and Abstracts Views on Vision4Press platform.
Data correspond to usage on the plateform after 2015. The current usage metrics is available 48-96 hours after online publication and is updated daily on week days.
Initial download of the metrics may take a while.