Fig. 2
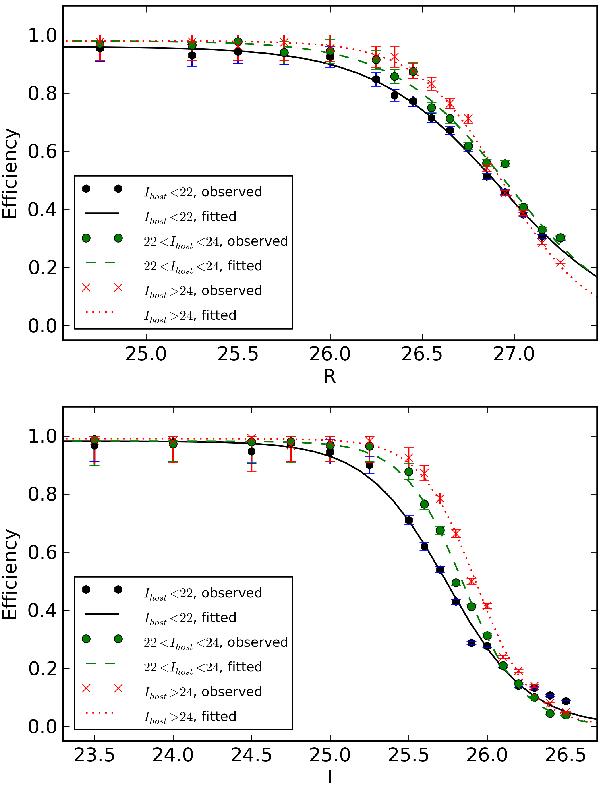
An example of the detection efficiency for a given epoch for different host galaxy brightness. The efficiencies from simulations of supernovae in the field are given by the points while the lines are the S-curve fits to the efficiencies as described in the text. Errors for the measured efficiencies are binomial. Note that a total of 30 (one for each of five epochs × , two filters × , and three host galaxy types) S-curve fits have been used to estimate the detection efficiencies of the full survey. This figure is available in colour in the electronic version of the article.
Current usage metrics show cumulative count of Article Views (full-text article views including HTML views, PDF and ePub downloads, according to the available data) and Abstracts Views on Vision4Press platform.
Data correspond to usage on the plateform after 2015. The current usage metrics is available 48-96 hours after online publication and is updated daily on week days.
Initial download of the metrics may take a while.