Fig. 12
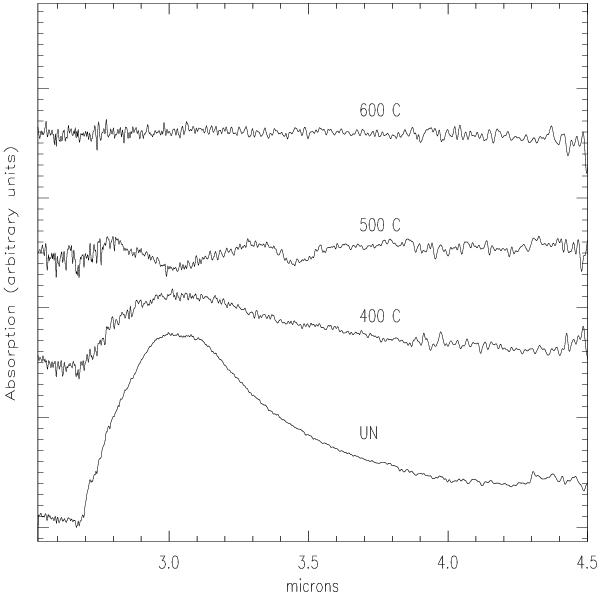
2.5 to 4.5 μm portion of the IR spectra measured for MgSiO3 samples at selected annealing temperatures chosen to represent those points in Fig. 10 where the relative proportions of Si2O5, SiO3 and SiO4 exhibit strong differences. The decrease in the broad band at ~3 μm indicates a decrease in hydration through the loss of interstitial H2O and bonded OH.
Current usage metrics show cumulative count of Article Views (full-text article views including HTML views, PDF and ePub downloads, according to the available data) and Abstracts Views on Vision4Press platform.
Data correspond to usage on the plateform after 2015. The current usage metrics is available 48-96 hours after online publication and is updated daily on week days.
Initial download of the metrics may take a while.