Fig. 6
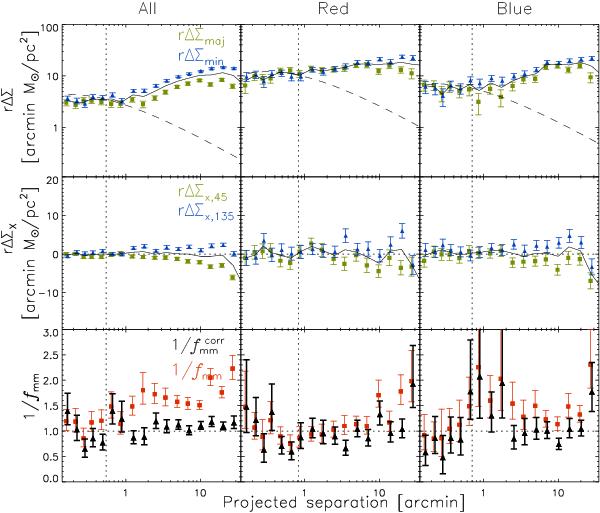
Lensing signal multiplied with the projected separation in arcmin as a function of
angular distance from the lens, for the “all” lens sample (left-hand
panels), the “red” lens sample (middle panels) and the
“blue” lens sample (right-hand panels). In the top
panels, the green squares (blue triangles) show the average
rΔΣ along the major (minor) axis (quadrants B (A) in Fig. 3). The dashed lines indicate the best fit NFW
profile times the projected separation, fitted to the azimuthally averaged lensing
signal on scales between 50 and 500 kpc using the mean lens redshift. In the
middle panel, the green squares (blue triangles) show the cross
shear signal averaged in quadrant D (C) of Fig. 3. In the bottom panels,
1 / fmm and
 are shown by
the red squares and black triangles, respectively. The dotted lines indicate the
virial radius from the best-fit NFW profiles. The shear ratio does not provide clear
signs for the alignment between galaxies and their dark matter haloes.
are shown by
the red squares and black triangles, respectively. The dotted lines indicate the
virial radius from the best-fit NFW profiles. The shear ratio does not provide clear
signs for the alignment between galaxies and their dark matter haloes.
Current usage metrics show cumulative count of Article Views (full-text article views including HTML views, PDF and ePub downloads, according to the available data) and Abstracts Views on Vision4Press platform.
Data correspond to usage on the plateform after 2015. The current usage metrics is available 48-96 hours after online publication and is updated daily on week days.
Initial download of the metrics may take a while.