Fig. 5
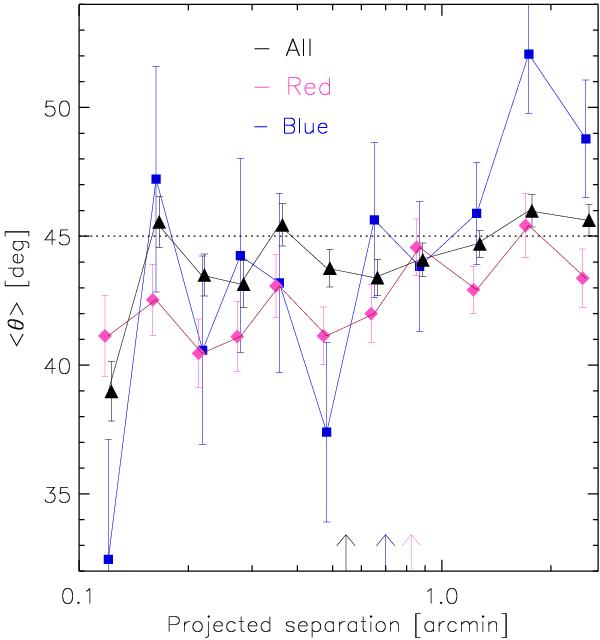
Mean angle between the location of the satellites and the major axis of the lens galaxy as a function of projected separation. The black triangles, purple diamonds and blue squares indicate the results for the “all”, “red” and “blue” lens sample. The arrows on the horizontal axis indicate the location of the virial radii at the mean redshift of the lenses, and correspond to 150 kpc, 280 kpc and 192 kpc for the “all”, “red” and “blue” lens samples, respectively. The satellite galaxies preferentially reside near the major axis of the lenses.
Current usage metrics show cumulative count of Article Views (full-text article views including HTML views, PDF and ePub downloads, according to the available data) and Abstracts Views on Vision4Press platform.
Data correspond to usage on the plateform after 2015. The current usage metrics is available 48-96 hours after online publication and is updated daily on week days.
Initial download of the metrics may take a while.