Fig. 4
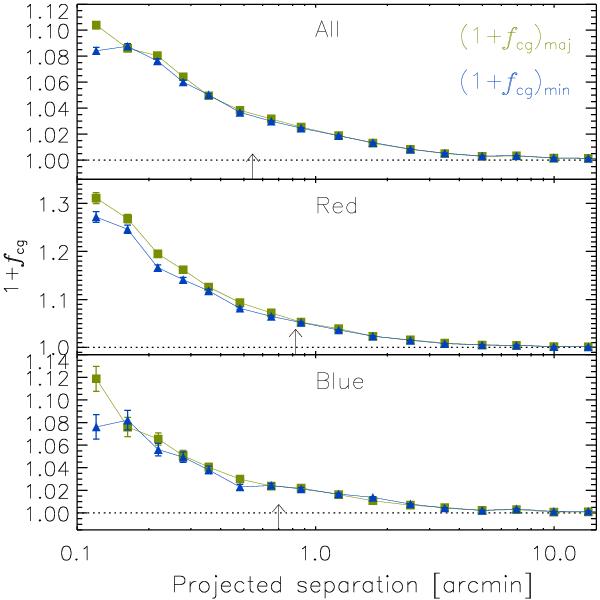
Excess source galaxy density ratio as a function of projected distance to the lenses. The green squares (blue triangles) indicate the excess density ratio measured using sources within 45 degrees of the major (minor) axis. The arrows indicate the location of the virial radius at the mean redshift of the lenses. We find that the excess density ratio along the major axis is higher than along the minor axis, most noticeably for the “red” sample. Please note the different scales of the vertical axes.
Current usage metrics show cumulative count of Article Views (full-text article views including HTML views, PDF and ePub downloads, according to the available data) and Abstracts Views on Vision4Press platform.
Data correspond to usage on the plateform after 2015. The current usage metrics is available 48-96 hours after online publication and is updated daily on week days.
Initial download of the metrics may take a while.