Fig. F.1
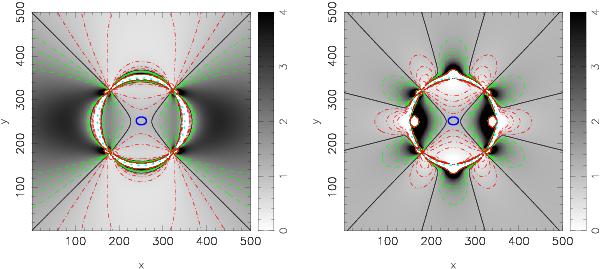
Observed shear ratio of an elliptical lens L1 at z = 0.4 for
sources at a projected separation of 100 arcsec, in the presence of an additional
foreground galaxy L2 at z = 0.1 that is located at
(x,y). In the left-hand panel we show
 ,
the ratio of the average shear along the major and minor axis. The location of L1
is indicated by the blue ellipse in the centre of the image, the location of the
sources by the cyan dots. We find that depending on the position of L2, the shear
ratio either increases or decreases. The black solid lines indicate the position
of L2 where
remains constant, the red dot-dashed (green dashed) lines indicate a decrease
(increase) of
of 0.2, 0.4 and 0.6, respectively. In the right-hand panel, we
show
,
the ratio of the average shear along the major and minor axis. The location of L1
is indicated by the blue ellipse in the centre of the image, the location of the
sources by the cyan dots. We find that depending on the position of L2, the shear
ratio either increases or decreases. The black solid lines indicate the position
of L2 where
remains constant, the red dot-dashed (green dashed) lines indicate a decrease
(increase) of
of 0.2, 0.4 and 0.6, respectively. In the right-hand panel, we
show  ,
the shear ratio corrected using the cross terms. For large L2-source separations,
the induced shear on the lens and the sources is almost constant, and is
effectively removed using the cross terms. For small separations, the residual is
large as the applied shear from L2 varies strongly along the ring of sources. Note
that both L1 and L2 are modeled by an SIS.
,
the shear ratio corrected using the cross terms. For large L2-source separations,
the induced shear on the lens and the sources is almost constant, and is
effectively removed using the cross terms. For small separations, the residual is
large as the applied shear from L2 varies strongly along the ring of sources. Note
that both L1 and L2 are modeled by an SIS.
Current usage metrics show cumulative count of Article Views (full-text article views including HTML views, PDF and ePub downloads, according to the available data) and Abstracts Views on Vision4Press platform.
Data correspond to usage on the plateform after 2015. The current usage metrics is available 48-96 hours after online publication and is updated daily on week days.
Initial download of the metrics may take a while.