Fig. B.1
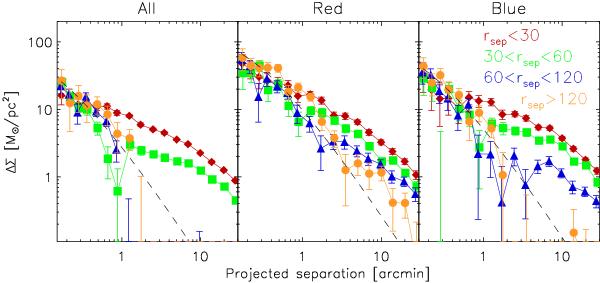
The lensing signal as a function of projected separation for the three lens samples that have been divided according to the minimum distance to a brighter galaxy, as indicated in the top right panel. The red diamonds indicate the lensing signal of those lenses that have a brighter neighbour within 30 arcsec, the green squares the signal of the lenses that have a brighter neighbour between 30 and 60 arcsec, the blue triangles the signal of the lenses that have a brighter neighbour between 60 and 120 arcsec, and the orange circles the signal of the lenses that have no brighter neighbour within 2 arcmin. The dashed lines show the best fit NFW profiles fitted to the lensing signal of the total sample between 50 and 500 kpc using the mean lens redshift. The lensing signal on scales < 0.5 arcmin is roughly similar for all lens samples, but the lensing signal on larger scales clearly decreases for increasingly isolated galaxies.
Current usage metrics show cumulative count of Article Views (full-text article views including HTML views, PDF and ePub downloads, according to the available data) and Abstracts Views on Vision4Press platform.
Data correspond to usage on the plateform after 2015. The current usage metrics is available 48-96 hours after online publication and is updated daily on week days.
Initial download of the metrics may take a while.