Fig. 11
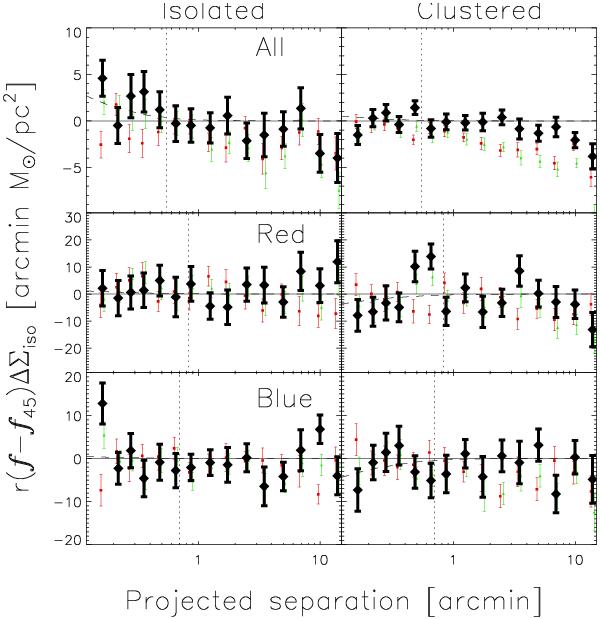
Anisotropic shear signal multiplied with the projected separation in arcmin around the “all” sample (top panels), the “red” sample (middle panels) and the “blue” sample (bottom panels), for the isolated lenses on the left-hand side, and the clustered lenses on the right-hand side (using w ∝ e1.0). The green triangles denote fΔΣiso, the red squares f45ΔΣiso, and the black diamonds (f − f45)ΔΣiso. The vertical dotted lines indicate the virial radius at the mean lens redshift, the dashed lines indicate the best fit elliptical NFW profiles. Please note the different scalings of the vertical axes. For the “all” sample, the shear anisotropy is larger for the isolated sample; for the “red” and “blue” sample, the shear anisotropy is more negative on small scales for the clustered samples, but the differences are not significant when averaged within the virial radius.
Current usage metrics show cumulative count of Article Views (full-text article views including HTML views, PDF and ePub downloads, according to the available data) and Abstracts Views on Vision4Press platform.
Data correspond to usage on the plateform after 2015. The current usage metrics is available 48-96 hours after online publication and is updated daily on week days.
Initial download of the metrics may take a while.