Fig. 10
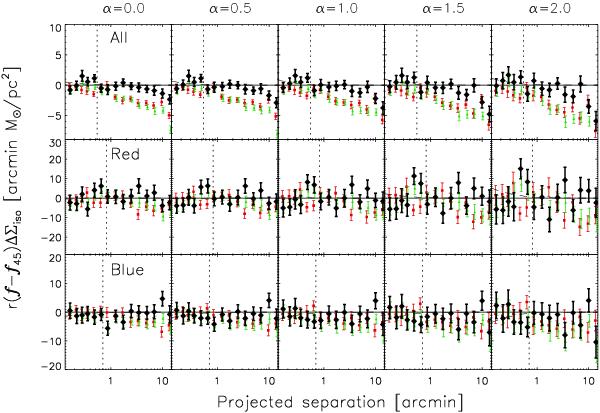
Anisotropic shear signal around the “all” lenses (top panels), the “red” lenses (middle panels) and the “blue” lenses (bottom panels). The signal has been multiplied with the projected separation in arcmin to enhance the visibility of the signal on large scales. The green triangles denote rfΔΣiso, the red squares rf45ΔΣiso, and the black diamonds r(f − f45)ΔΣiso. The vertical dotted lines indicate the virial radius at the mean lens redshift, the dashed lines show the best fit elliptical NFW profiles. Indicated on top of each column is the weight applied to the measurement. The average shear anisotropy of the “all” and “red” lenses is weakly positive within the virial radius, supporting the presence of triaxial dark matter haloes that are reasonably aligned with the galaxies. For the “blue” lenses the signal is marginally negative. Note that the measurements shown here are not corrected for the anisotropic distribution of satellite galaxies.
Current usage metrics show cumulative count of Article Views (full-text article views including HTML views, PDF and ePub downloads, according to the available data) and Abstracts Views on Vision4Press platform.
Data correspond to usage on the plateform after 2015. The current usage metrics is available 48-96 hours after online publication and is updated daily on week days.
Initial download of the metrics may take a while.