Fig. 1
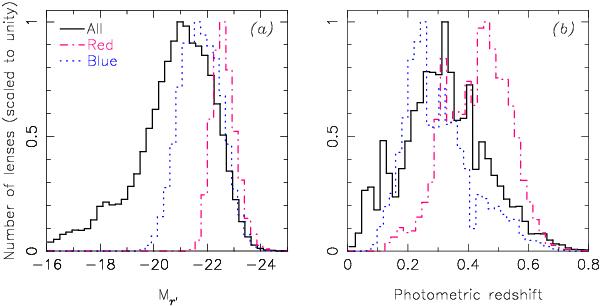
Number of lenses as a function of absolute magnitude a) and redshift b) for the three lens samples, obtained by applying identical cuts to the CFHTLS W1 photometric redshift catalogue from the CFHTLenS collaboration (Hildebrandt et al. 2012). The “all” sample (black solid lines) has the broadest distributions, and covers absolute r′-band magnitudes between −18 and −24, and redshifts between 0 and 0.6. The luminosities of the “blue” sample (blue dotted lines) are in the range −24 < Mr < −20, with redshifts 0.15 < z < 0.6. The “red” sample (purple dot-dashed lines) has the narrowest distributions, with luminosities −24 < Mr < −22 and redshifts 0.3 < z < 0.6.
Current usage metrics show cumulative count of Article Views (full-text article views including HTML views, PDF and ePub downloads, according to the available data) and Abstracts Views on Vision4Press platform.
Data correspond to usage on the plateform after 2015. The current usage metrics is available 48-96 hours after online publication and is updated daily on week days.
Initial download of the metrics may take a while.