Fig. 9
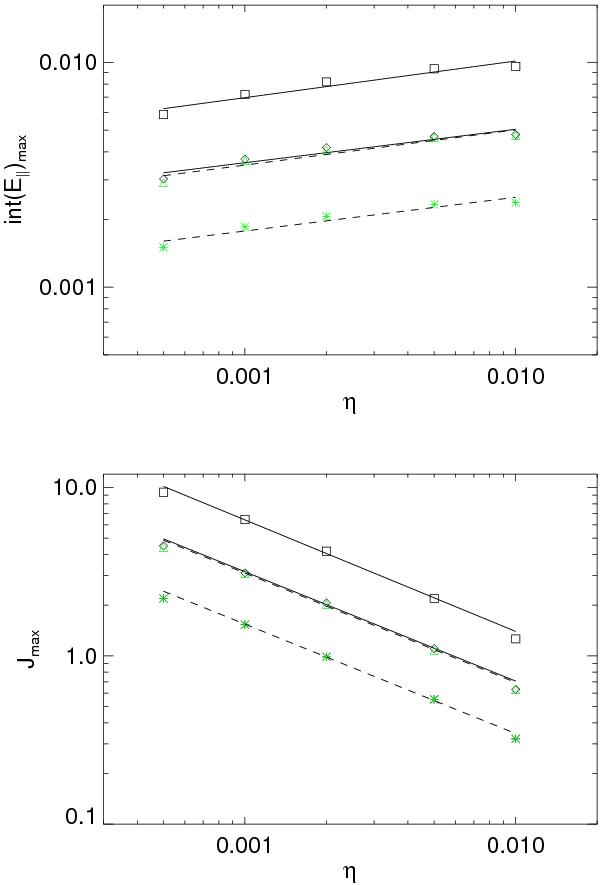
Log-log plots of peak reconnection rate (top panel) and peak current (bottom panel) against η. Black points: two pulses sent at the same time (diamonds: v0 = 0.01, squares: v0 = 0.02). Green points: one pulse (asterisks: v0 = 0.01, triangles: v0 = 0.02). The lines depict the lines of best fit for two pulses sent at the same time (solid) and one pulse (dashed) in each case. (This figure is available in color in the electronic form.)
Current usage metrics show cumulative count of Article Views (full-text article views including HTML views, PDF and ePub downloads, according to the available data) and Abstracts Views on Vision4Press platform.
Data correspond to usage on the plateform after 2015. The current usage metrics is available 48-96 hours after online publication and is updated daily on week days.
Initial download of the metrics may take a while.