Fig. 5
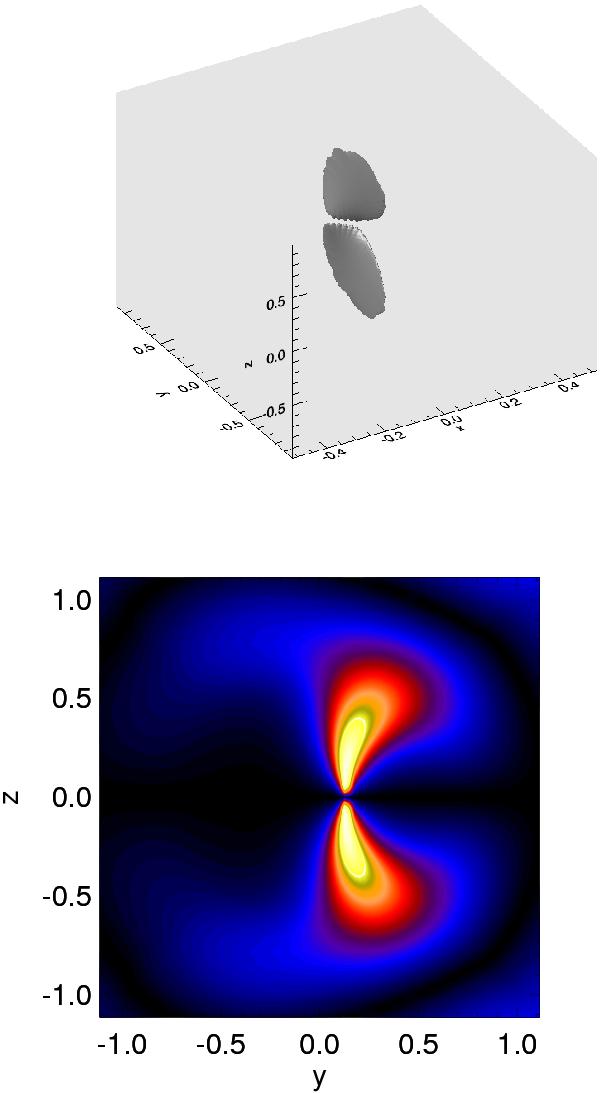
Top: an iso-surface (at 50% of maximum) of |E ∥ |. Bottom: a contour plot of |E ∥ | in the x = −0.005 plane (containing the null point). For the case of one pulse with v0 = 0.04 and τ = 1.8. Taken at the point where the null is most displaced from its initial position. Note the asymmetrical shape (in the y-direction) of the strong E ∥ regions near the null point. (This figure is available in color in the electronic form.)
Current usage metrics show cumulative count of Article Views (full-text article views including HTML views, PDF and ePub downloads, according to the available data) and Abstracts Views on Vision4Press platform.
Data correspond to usage on the plateform after 2015. The current usage metrics is available 48-96 hours after online publication and is updated daily on week days.
Initial download of the metrics may take a while.