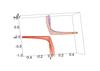
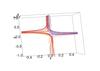
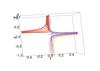
Fig. 4
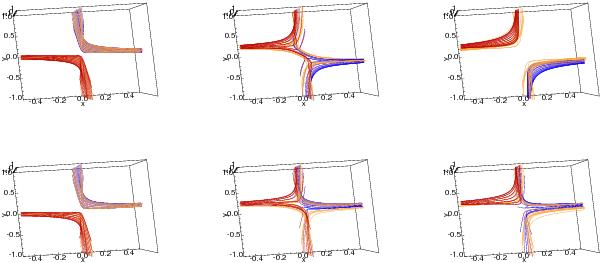
The change in connectivity with two simultaneous pulses (top) one pulse (bottom) and when v0 = 0.04, Ad = 80 and η = 5 × 10⁻⁴. The red and blue flux tubes (traced from the driving boundaries) are initially connected to the gold field lines anchored on the side boundaries. Taken at times t = 1 (left), 3 (middle) and 5 (right). (This figure is available in color in the electronic form.)
Current usage metrics show cumulative count of Article Views (full-text article views including HTML views, PDF and ePub downloads, according to the available data) and Abstracts Views on Vision4Press platform.
Data correspond to usage on the plateform after 2015. The current usage metrics is available 48-96 hours after online publication and is updated daily on week days.
Initial download of the metrics may take a while.