Fig. 3
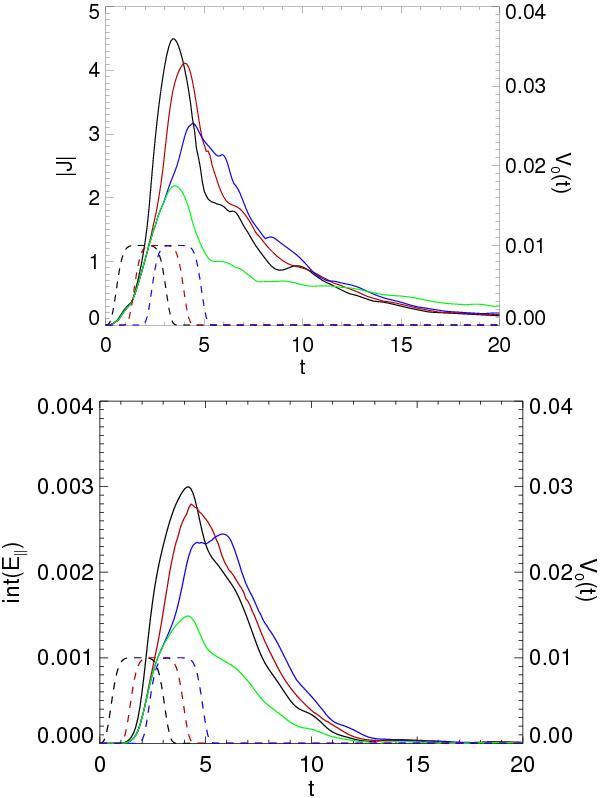
Solid lines (top panel): |J| plotted against t. Solid lines (bottom panel): ∫E ∥ dl plotted against t. For the cases with two pulses the dashed lines indicate the driving amplitude of the second pulse. Black: tlag = 0, red: tlag = 0.9 and blue: tlag = 1.8. The solid green line is with only one pulse. For the case of v0 = 0.01. (This figure is available in color in the electronic form.)
Current usage metrics show cumulative count of Article Views (full-text article views including HTML views, PDF and ePub downloads, according to the available data) and Abstracts Views on Vision4Press platform.
Data correspond to usage on the plateform after 2015. The current usage metrics is available 48-96 hours after online publication and is updated daily on week days.
Initial download of the metrics may take a while.