Fig. 1
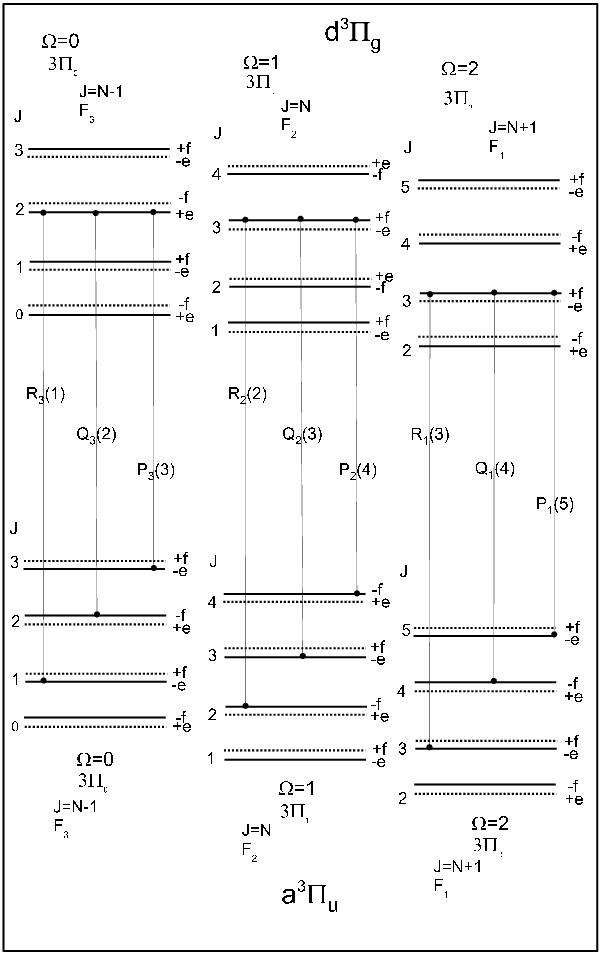
Swan band transitions and structure of the rotational energy levels of  for the d3Πu and a3Πg states. The dotted lines correspond to missing levels. The Q3 lines have a zero transition probability, according to the Hönl-London factors given in Table 2. The Q2 and Q1 relative transition probabilities (compared to the P and R lines) rapidly decrease with increasing J values.
Current usage metrics show cumulative count of Article Views (full-text article views including HTML views, PDF and ePub downloads, according to the available data) and Abstracts Views on Vision4Press platform.
Data correspond to usage on the plateform after 2015. The current usage metrics is available 48-96 hours after online publication and is updated daily on week days.
Initial download of the metrics may take a while.