Fig. 9
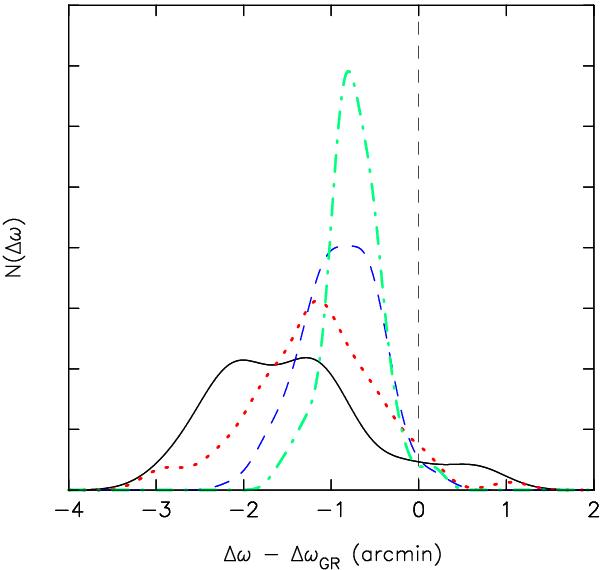
Histograms of the predicted change in S2’s argument of peribothron, ω, over the course one orbital period (~16 yr). The shift due to relativity, (Δω)GR ≈ 11′, has been subtracted from the total; what remains is due to Newtonian perturbations from the field stars. Each histogram was constructed from integrations of 100 random realizations of the same initial model, with field-star mass m = 10 M⊙, and four different values of the total number: N = 200 (solid/black); N = 100 (dotted/red); N = 50 (dashed/blue); and N = 25 (dot-dashed/green). The average value of the peribothron shift increases with increasing Nm, as predicted by Eq. (11). The reasons for the spread in Δω values are discussed in the text.
Current usage metrics show cumulative count of Article Views (full-text article views including HTML views, PDF and ePub downloads, according to the available data) and Abstracts Views on Vision4Press platform.
Data correspond to usage on the plateform after 2015. The current usage metrics is available 48-96 hours after online publication and is updated daily on week days.
Initial download of the metrics may take a while.