Fig. 8
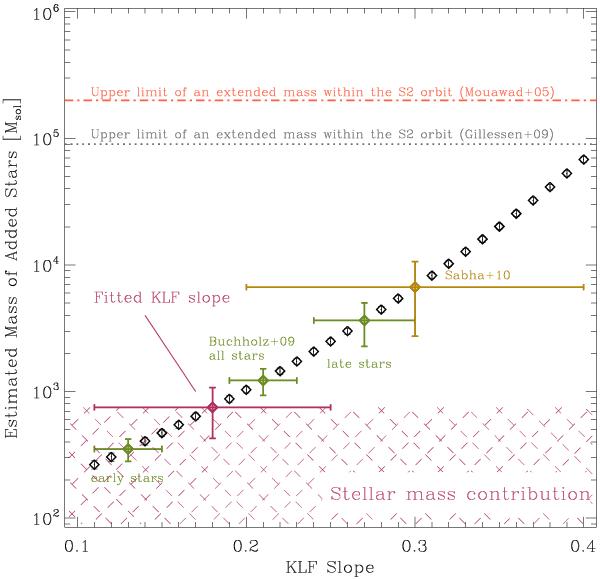
Estimated stellar mass from the added stars for different KLF slopes. Slopes of Buchholz et al. (2009) (for different stellar populations) are shown in green, NS10 in yellow and our fitted slope in purple. A limit imposed by the enclosed mass within the S2 orbit is plotted as horizontal dotted (gray) and dash-dotted (red) lines from Gillessen et al. (2009b) and Mouawad et al. (2005), respectively.
Current usage metrics show cumulative count of Article Views (full-text article views including HTML views, PDF and ePub downloads, according to the available data) and Abstracts Views on Vision4Press platform.
Data correspond to usage on the plateform after 2015. The current usage metrics is available 48-96 hours after online publication and is updated daily on week days.
Initial download of the metrics may take a while.