Fig. 6
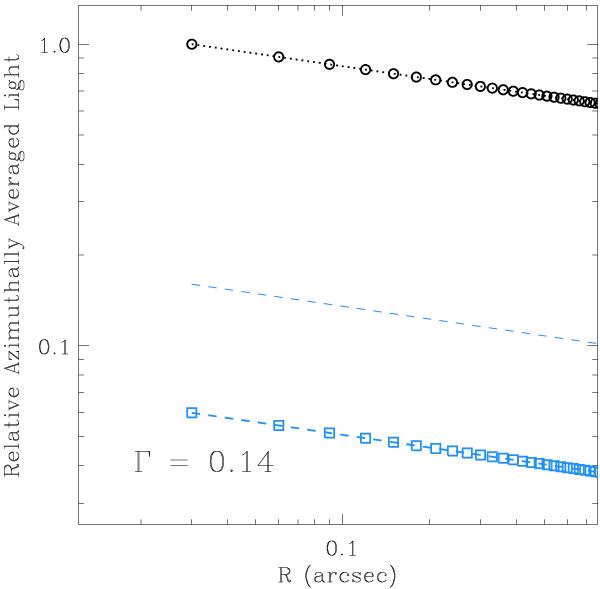
Relative azimuthally averaged light density, for the background light taken from the observations and the extra stellar light calculated from the extrapolation, plotted as a function of distance from Sgr A*. They are represented by a dotted line with circles (black) and dashed lines with squares (blue), respectively. The stellar light density is normalized to the peak light density of the background at the central resolution element. The upper limit of the extrapolated extra stellar light is shown as the blue dashed line with no symbols.
Current usage metrics show cumulative count of Article Views (full-text article views including HTML views, PDF and ePub downloads, according to the available data) and Abstracts Views on Vision4Press platform.
Data correspond to usage on the plateform after 2015. The current usage metrics is available 48-96 hours after online publication and is updated daily on week days.
Initial download of the metrics may take a while.