Fig. 5
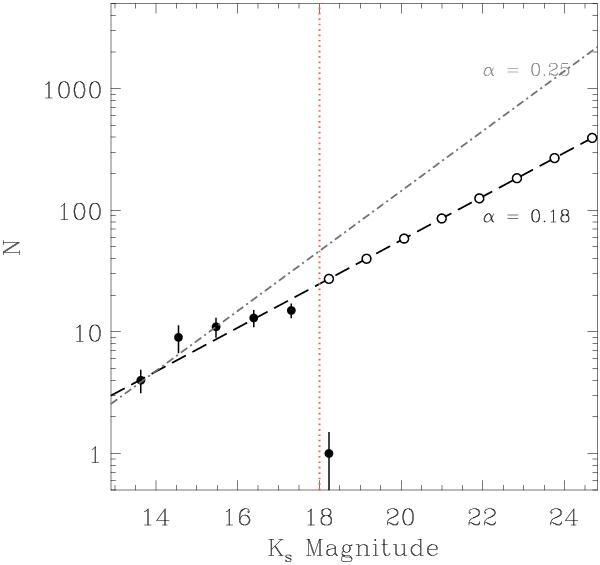
Extrapolation of the KLF power-law fit. The KLF slope of α = 0.18 and the upper limit imposed by the uncertainty in the fit (α = 0.25) are plotted as dashed and dash-dotted lines, respectively. The black filled circles represent the data while the hollow circles represent new points based on the extrapolated KLF slope. The approximate location of the detection limit is indicated by the vertical dotted/red line.
Current usage metrics show cumulative count of Article Views (full-text article views including HTML views, PDF and ePub downloads, according to the available data) and Abstracts Views on Vision4Press platform.
Data correspond to usage on the plateform after 2015. The current usage metrics is available 48-96 hours after online publication and is updated daily on week days.
Initial download of the metrics may take a while.