Fig. 1
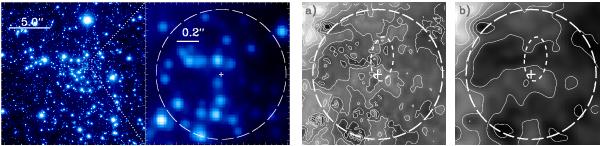
Left: 17.5′′ × 17.5′′ NACO Ks-band mosaic of the central cluster zoomed in to the inner 1−2′′ region around Sgr A*. The inner region is indicated by a dashed (white) circle. Right: a) map of the diffuse background light within a circle of 0.69′′ radius centered on the position of Sgr A*, shown here as a cross at the center. The projected orbit of the star S2 is over-plotted as an ellipse. b) The same map smoothed by convolution with a Gaussian beam of FWHM = 6 pixels. The contours levels are at 95%, 90%, 80%, 70%, 60%, 50%, 40%, 30%, 20% and 10% of the maximum flux value for each image.
Current usage metrics show cumulative count of Article Views (full-text article views including HTML views, PDF and ePub downloads, according to the available data) and Abstracts Views on Vision4Press platform.
Data correspond to usage on the plateform after 2015. The current usage metrics is available 48-96 hours after online publication and is updated daily on week days.
Initial download of the metrics may take a while.