Free Access
Fig. 6
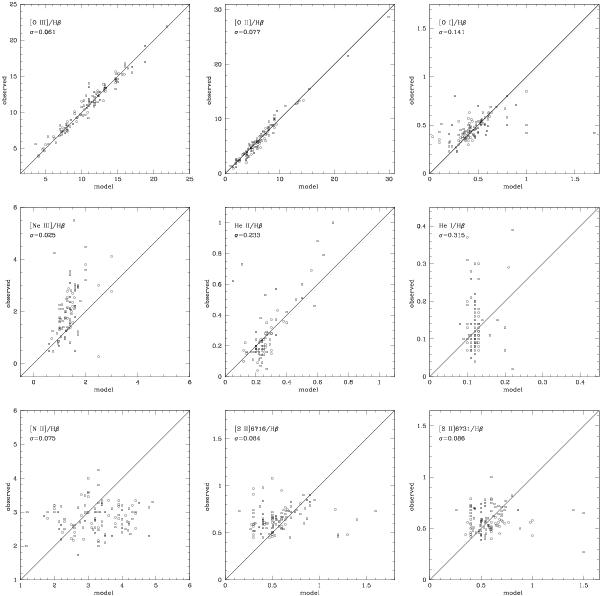
Comparison between the observed and the calculated emission line ratios for the lines in Table 2. σ is the median error for the observed ratios. The solid line is the 1:1 line.
Current usage metrics show cumulative count of Article Views (full-text article views including HTML views, PDF and ePub downloads, according to the available data) and Abstracts Views on Vision4Press platform.
Data correspond to usage on the plateform after 2015. The current usage metrics is available 48-96 hours after online publication and is updated daily on week days.
Initial download of the metrics may take a while.