Fig. 5
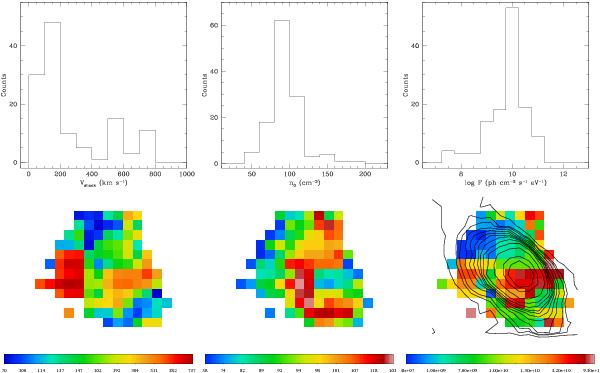
Top: histograms of the shock velocities (left), pre-shock density (middle) and the AGN ionizing flux (right). Bottom: 2D maps of the same parameters. The units are km s-1 (left), cm-3 (middle) and ph cm-2 s-1 eV-1 (right). Spatial scale is 1 arcsec px-1. Contours of the stellar continuum are overplotted onto the map of the ionizing flux. North is up and east is to the left.
Current usage metrics show cumulative count of Article Views (full-text article views including HTML views, PDF and ePub downloads, according to the available data) and Abstracts Views on Vision4Press platform.
Data correspond to usage on the plateform after 2015. The current usage metrics is available 48-96 hours after online publication and is updated daily on week days.
Initial download of the metrics may take a while.