Fig. 14
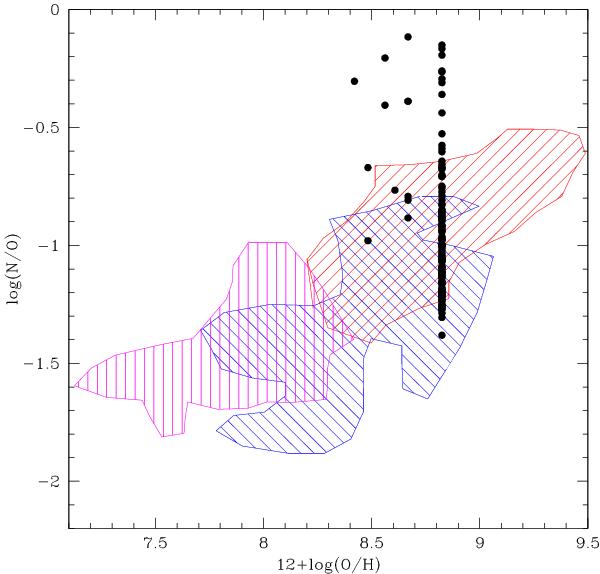
N/O vs. O/H diagram adapted from Mouhcine & Contini (2002, see their Fig. 1). The blue area represents a sample of UV-selected galaxies, the red area includes starburst nucleus galaxies (SBNGs) selected in the optical or in the infrared, and the magenta area represents H ii galaxies. The results of our model calculations are overplotted (black circles).
Current usage metrics show cumulative count of Article Views (full-text article views including HTML views, PDF and ePub downloads, according to the available data) and Abstracts Views on Vision4Press platform.
Data correspond to usage on the plateform after 2015. The current usage metrics is available 48-96 hours after online publication and is updated daily on week days.
Initial download of the metrics may take a while.