Free Access
Fig. 12
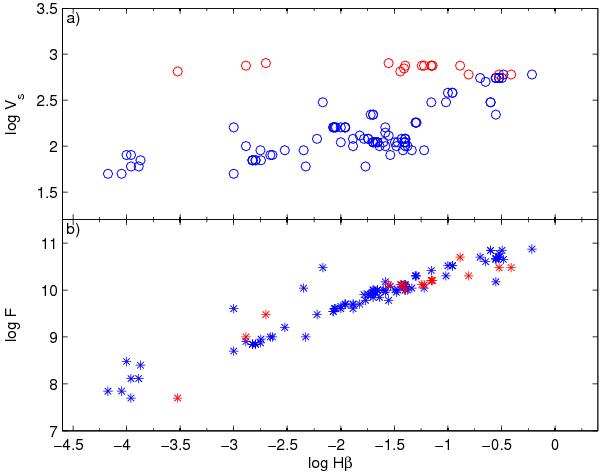
Shock velocities vs. Hβ calculated flux (top panel); fluxes from the active centre vs. Hβ calculated flux (bottom panel). Red: models calculated with high Vs (> 700 km s-1); blue: the other models.
Current usage metrics show cumulative count of Article Views (full-text article views including HTML views, PDF and ePub downloads, according to the available data) and Abstracts Views on Vision4Press platform.
Data correspond to usage on the plateform after 2015. The current usage metrics is available 48-96 hours after online publication and is updated daily on week days.
Initial download of the metrics may take a while.