Fig. 5
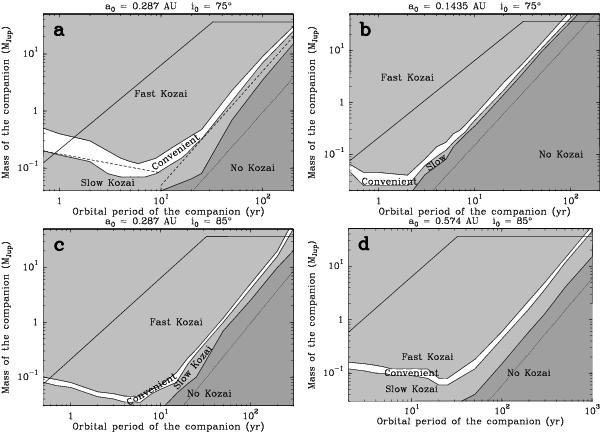
Result of the exploration of the parameter space for four (a0,i0) combinations. a) a0 = 0.287 AU, i0 = 75°; b) a0 = 0.1435 AU, i0 = 75°; c) a0 = 0.287 AU, i0 = 85°; d) a0 = 0.574 AU, i0 = 85°. In each plot, the upper observational limits (radial velocities and imaging) are represented as a solid line; the oblique dotted line corresponds to the limit tGR = tKozai as given by Matsumura et al. (2009). In the upper left plot, the dashed lined are m′ ∝ T′ − 1/3 and m′ ∝ T′2 power laws (see text).
Current usage metrics show cumulative count of Article Views (full-text article views including HTML views, PDF and ePub downloads, according to the available data) and Abstracts Views on Vision4Press platform.
Data correspond to usage on the plateform after 2015. The current usage metrics is available 48-96 hours after online publication and is updated daily on week days.
Initial download of the metrics may take a while.