Table 3
Rotational emission lines in comet C/2004 Q2 (Machholz) observed by SMT on 13–16 January 2005.
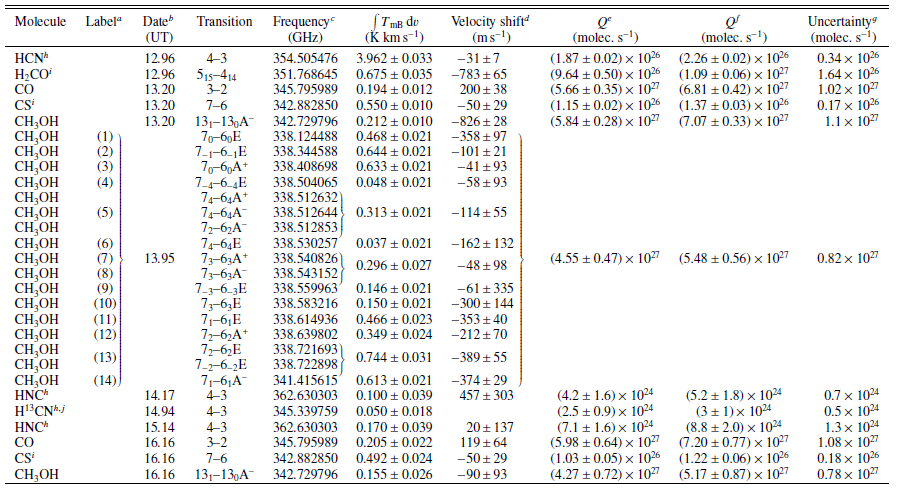
Labels in Fig. 1.
The line frequencies were obtained from the latest online edition of the JPL Molecular Spectroscopy Catalog (Pickett et al. 1998).
The velocity offsets are computed with respect to the optocenters of the complete components for blended lines.
The uncertainty in the production rates are 1-σ uncertainties considering the receiver sideband gain ratio, main beam efficiency and kinetic temperature errors.
Current usage metrics show cumulative count of Article Views (full-text article views including HTML views, PDF and ePub downloads, according to the available data) and Abstracts Views on Vision4Press platform.
Data correspond to usage on the plateform after 2015. The current usage metrics is available 48-96 hours after online publication and is updated daily on week days.
Initial download of the metrics may take a while.