Fig. 3

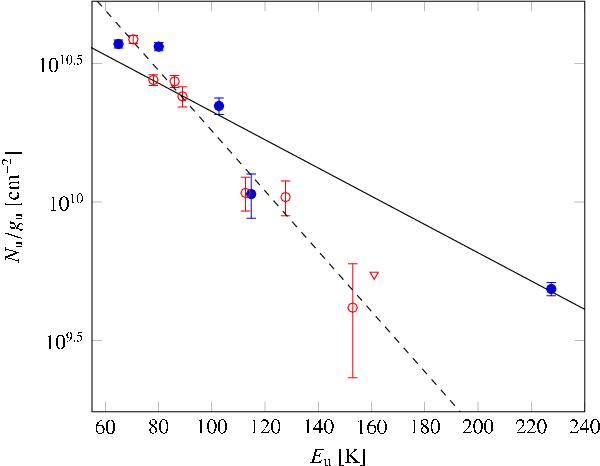
Rotation diagram for CH3OH lines in comet C/2004 Q2 (Machholz) including 1-σ uncertainties. The column density of the upper level divided by its degeneracy in logarithmic scale is plotted against the energy of the upper level. Filled (blue) circles are A and A-CH3OH lines, empty (red) circles denote E-CH3OH transitions and the empty (red) triangle indicates the 3-σ upper limit on the J = 74–64E transition at 338.530 GHz. The solid line shows the best linear fit with a derived rotational temperature of 85±7 K. The dashed line shows the best linear fit excluding the J = 131–130A transition at 342.730 GHz (energy of the upper state of ~228 K relative to the ground state) with a derived rotational temperature of 40 ± 3 K.
Current usage metrics show cumulative count of Article Views (full-text article views including HTML views, PDF and ePub downloads, according to the available data) and Abstracts Views on Vision4Press platform.
Data correspond to usage on the plateform after 2015. The current usage metrics is available 48-96 hours after online publication and is updated daily on week days.
Initial download of the metrics may take a while.


