Fig. 9
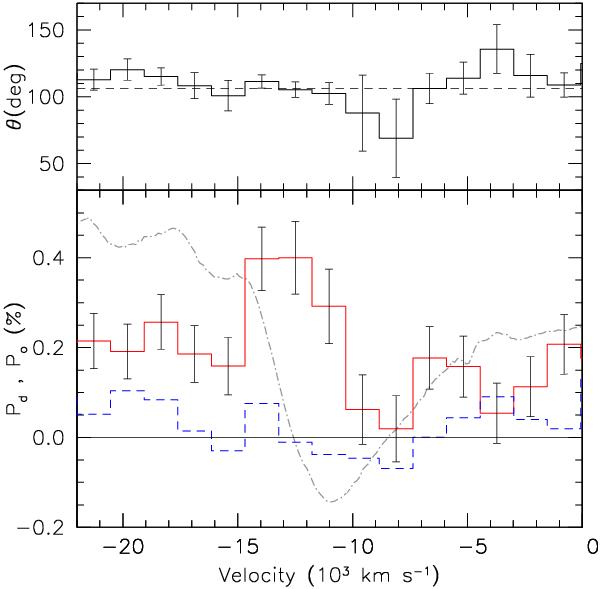
Lower panel: polarization profile of Si ii λ6355 at the combined pre-maximum epoch. Solid and dashed lines trace Pd and Po, respectively (12 px bins, ~ 35 Å). The dotted-dashed curve is the unbinned flux spectrum arbitrarily scaled. Upper panel: polarization position angle. The horizontal dashed line indicates the dominant axis angle θd.
Current usage metrics show cumulative count of Article Views (full-text article views including HTML views, PDF and ePub downloads, according to the available data) and Abstracts Views on Vision4Press platform.
Data correspond to usage on the plateform after 2015. The current usage metrics is available 48-96 hours after online publication and is updated daily on week days.
Initial download of the metrics may take a while.