Fig. 14
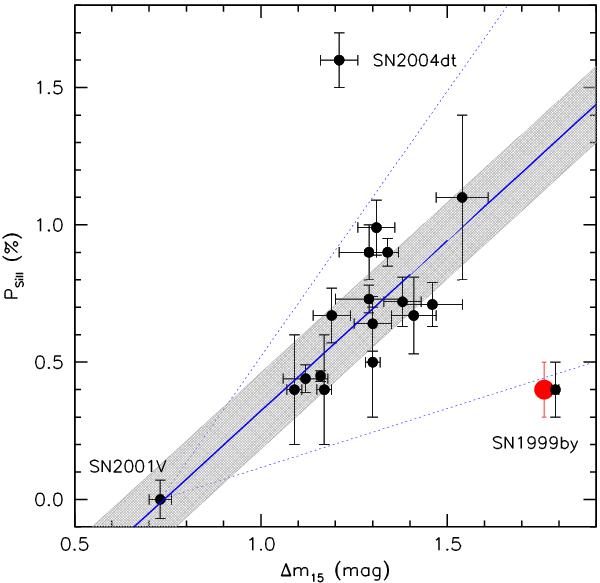
Degree of polarization across the Si ii λ6355 line as a function of light curve decline rate. Data are from Wang et al. (2007) and Patat et al. (2009a). SN 2005ke is marked by the large dot close to SN 1999by. The solid line is a best fit to all data, with the exception of SN 1999by, 2004dt, and 2005ke. The dotted lines trace the 1-σ level of the intrinsic polarization distribution generated by the Monte-Carlo simulation discussed by Wang et al. (2007). The shaded area indicates the rms deviation of the data points from the best fit relation.
Current usage metrics show cumulative count of Article Views (full-text article views including HTML views, PDF and ePub downloads, according to the available data) and Abstracts Views on Vision4Press platform.
Data correspond to usage on the plateform after 2015. The current usage metrics is available 48-96 hours after online publication and is updated daily on week days.
Initial download of the metrics may take a while.