Fig. A.2
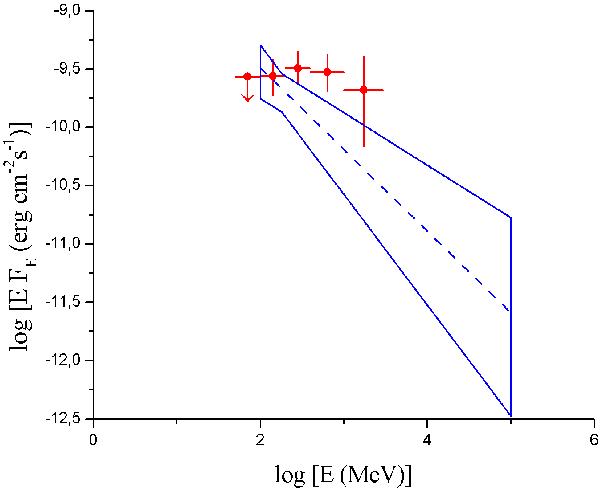
The νFν spectra of Cygnus X-3 during the γ-ray activity. Red circles: AGILE-GRID energy spectrum (50 MeV to 3 GeV) of the main episodes (Fig. A.1). Blue error contours and dashed blue line: average power-law fit with α = 2.70±0.25 of the spectrum obtained by Fermi-LAT integrating the two active windows of about two months each (Abdo et al. 2009).
Current usage metrics show cumulative count of Article Views (full-text article views including HTML views, PDF and ePub downloads, according to the available data) and Abstracts Views on Vision4Press platform.
Data correspond to usage on the plateform after 2015. The current usage metrics is available 48-96 hours after online publication and is updated daily on week days.
Initial download of the metrics may take a while.