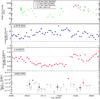
Fig. 2
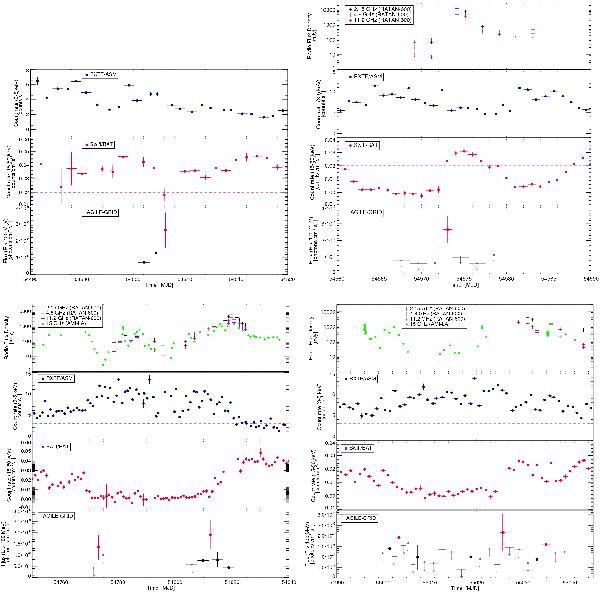
Multi-frequency light curves centered on the main events of γ-ray activity detected by the AGILE-GRID (detailed views of the main plot in Fig. 1). Upper-left plot: from 2008 January 30 to 2008 February 24 (MJD: 54 495−54 520). Upper-right plot: from 2008 April 4 to 2008 May 4 (MJD: 54 560−54 590). Lower-left plot: from 2008 October 11 to 2009 January 9 (MJD: 54 750−54 840). Lower-right plot: from 2009 June 8 to 2009 August 2 (MJD: 54 990−55 045).
Current usage metrics show cumulative count of Article Views (full-text article views including HTML views, PDF and ePub downloads, according to the available data) and Abstracts Views on Vision4Press platform.
Data correspond to usage on the plateform after 2015. The current usage metrics is available 48-96 hours after online publication and is updated daily on week days.
Initial download of the metrics may take a while.