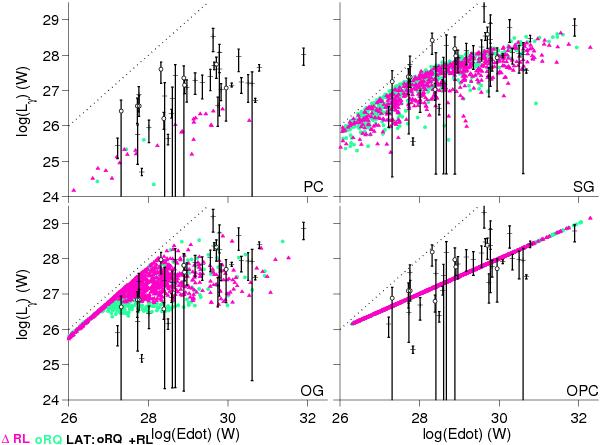
Fig. 15

Distribution of the γ-ray luminosities obtained for each model as a function of the spin-down power. Pink and green dots refer to radio-loud and radio-quiet γ-ray visible objects, respectively. The LAT luminosities (black circles and crosses for radio-loud and radio-quiet objects respectively) have been derived using the energy-flux measurement and the fΩ value estimated from the fit to the simulated data for the particular spin-down power and radio-loud or quiet state of the LAT pulsars. The dotted line shows the 100% efficiency boundary.
Current usage metrics show cumulative count of Article Views (full-text article views including HTML views, PDF and ePub downloads, according to the available data) and Abstracts Views on Vision4Press platform.
Data correspond to usage on the plateform after 2015. The current usage metrics is available 48-96 hours after online publication and is updated daily on week days.
Initial download of the metrics may take a while.


